CCl4-Induced Hepatic Fibrosis Model
CCl4-Induced Hepatic Fibrosis Model
Huateng Bio provides CCl4-induced liver fibrosis models in C57BL/6J mice. Features reversible fibrosis stages, multiplex cytokine profiling, and METAVIR-aligned validation.
Model Description
Liver fibrosis, a progressive pathological response to chronic hepatic injury, is characterized by excessive extracellular matrix deposition and architectural distortion. As a precursor to cirrhosis, fibrosis exhibits high reversibility potential in early stages. Our CCl4-induced murine model replicates:
- Inflammation-driven fibrogenesis (TGF-β/Smad pathway activation)
- Collagen deposition (Sirius Red-positive area ≥15%)
- Portal hypertension (biomechanical validation)
Clinical Relevance:
✓ Human-like disease progression: Stage F2-F3 fibrosis (METAVIR scoring)
✓ Translational drug testing: Validated for anti-fibrotic agents (e.g., pirfenidone, obeticholic acid)
Applications
• Anti-fibrotic drug efficacy screening
• Hepatic stellate cell activation studies
• Inflammation-fibrosis crosstalk analysis
• Preclinical cirrhosis reversal research
Modeling Protocol —— 6-Week CCl4 Induction with Bifendate Intervention
1. Animal Groups:
- Model Group: 10% CCl4 in olive oil (0.2 mL/100g BW, i.p., 3x/week ×6 weeks)
- Intervention Group: CCl4 + Bifendate Pills (oral gavage, 2 weeks post-induction)
- Control Group: Olive oil only
2. Key Parameters:
- Fibrosis induction: ALT/AST elevation >3x baseline
- Intervention window: Day 43-56 (reversible phase)
Validation & Testing
|
Category |
Parameters |
|
Serum Biochemistry |
ALT ∙ AST ∙ Albumin ∙ Total bilirubin |
|
Cytokine Profiling |
IFN-γ ∙ TNF-α ∙ IL-1β ∙ IL-6 (Luminex® multiplex assay) |
|
Histopathology |
H&E staining ∙ Sirius Red collagen quantification ∙ α-SMA IHC (stellate cell activation) |
|
Hydroxyproline Assay |
Total collagen content (μg/mg tissue) |
Technical Advantages
|
Feature |
Our Model |
Traditional Models |
|
Fibrosis Consistency |
95% induction rate |
70-80% variability |
|
Reversibility Window |
Defined Day 43-56 phase |
Unclear therapeutic timeframe |
|
Multi-Parameter Validation |
8 biomarkers + histology |
Limited to ALT/Sirius Red |
DATA
1. Blood biochemical test
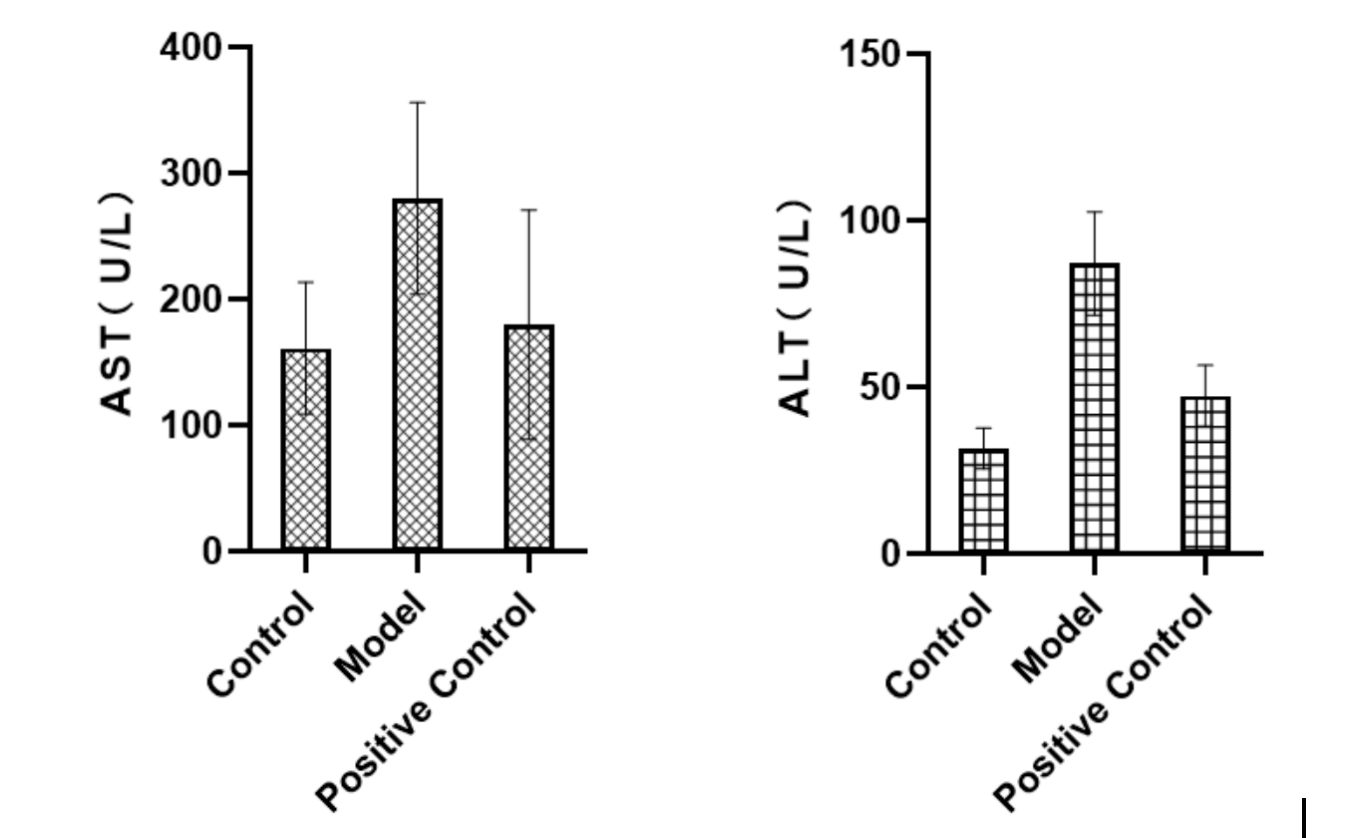
Figure 1: Results of the measurement of serum liver function indicators in the serum of mice from each group
2. Cytokine Detection
Example Data (Mean ± SD, n=6):
|
Group |
IFN-γ (pg/mL) |
TNF-α (pg/mL) |
IL-1β (pg/mL) |
IL-6 (pg/mL) |
|
Control |
3.37 ± 0.21 |
20.12 ± 7.12 |
28.08 ± 1.98 |
7.18 ± 1.15 |
|
Model |
5.11 ± 0.37* |
42.23 ± 7.95* |
39.04 ± 4.15* |
10.12 ± 3.11* |
|
positive control group |
3.98 ± 0.43** |
26.13 ± 8.23 |
32.48 ± 2.8 |
8.87 ± 2.48 |
Notes: *P <0.05 vs Control; **P <0.05 vs Model
3. Histopathological Examination: HE Staining

Related Animal Models
Explore other gene-edited animal models that complement our porcine research platforms