Major Depressive Disorder (MDD) Mouse Model

Major Depressive Disorder (MDD) Mouse Model
Huateng Bio's C57BL/6 chronic stress depression model replicates GABA/glutamate dysregulation & hippocampal impairment. Validated behavioral despair (FST/TST), anhedonia (<65% sucrose preference), and elevated IL-6/TNF-α. Ideal for antidepressant screening and neuroplasticity studies.
Model Description
Major depressive disorder is a neurotransmitter imbalance disease characterized by GABA/glutamate dysregulation and hippocampal neurogenesis impairment. Our chronic stress-induced depression model replicates:
• Behavioral despair (validated by FST/TST)
• Anhedonia (sucrose preference <65% vs controls)
• Neuroinflammation markers (IL-6/TNF-α elevation)
Clinically translational for studying neurological comorbidities in CNS disorders.
Applications
• Antidepressant drug screening (SSRI/SNRI efficacy validation)
• Neuroplasticity biomarker discovery (BDNF/TrkB pathway analysis)
• Stress-induced neuroinflammation mechanisms
• Gut-brain axis interaction studies
Modeling Protocol —— Chronic Restraint Stress (CRS) Method
1. Apparatus: Custom ventilated restraint tubes (50ml conical centrifuge tube with 8×1.5mm air holes)
2. Procedure: Daily 6-hour restraint stress for 30 consecutive days (10:00-16:00 light cycle)
3. Humane endpoints: Immediate release if respiratory distress observed
4. Post-stress monitoring: Body weight tracking every 72h
Validation & Endpoints
|
Category |
Assays |
|
Behavioral Tests |
• Tail Suspension Test (TST) |
|
Physiological |
• Body weight dynamics |
|
Immunological |
• IL-6/TNF-α cytokine profiling |
|
Neurohistology |
• Hippocampal H&E staining |
Data
1. Body Weight Measurement
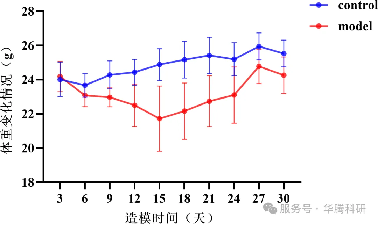
Body Weight Changes,* p < 0.05 vs control group
2. Ethology
Tail suspension test, forced swimming test, open field test, sucrose preference test, elevated plus maze ethology test.
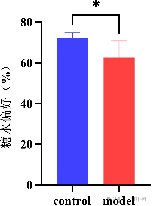
Preference for sugar water, Note: * indicates p < 0.05

Figure 2. Immobility time in tail suspension test and open field test. ** indicates p < 0.01, ns indicates no significant difference.
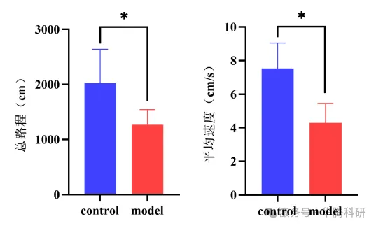
Figure 3 Total Distance and Average Speed in the Open Field
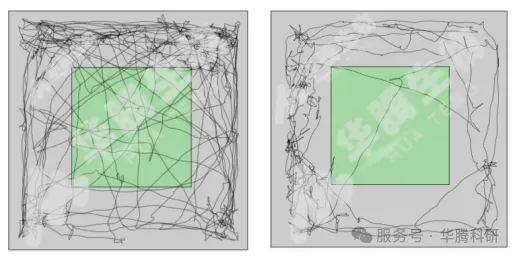
Figure 4 Open field trajectory (control - left, model - right)
Related Animal Models
Explore other gene-edited animal models that complement our porcine research platforms